
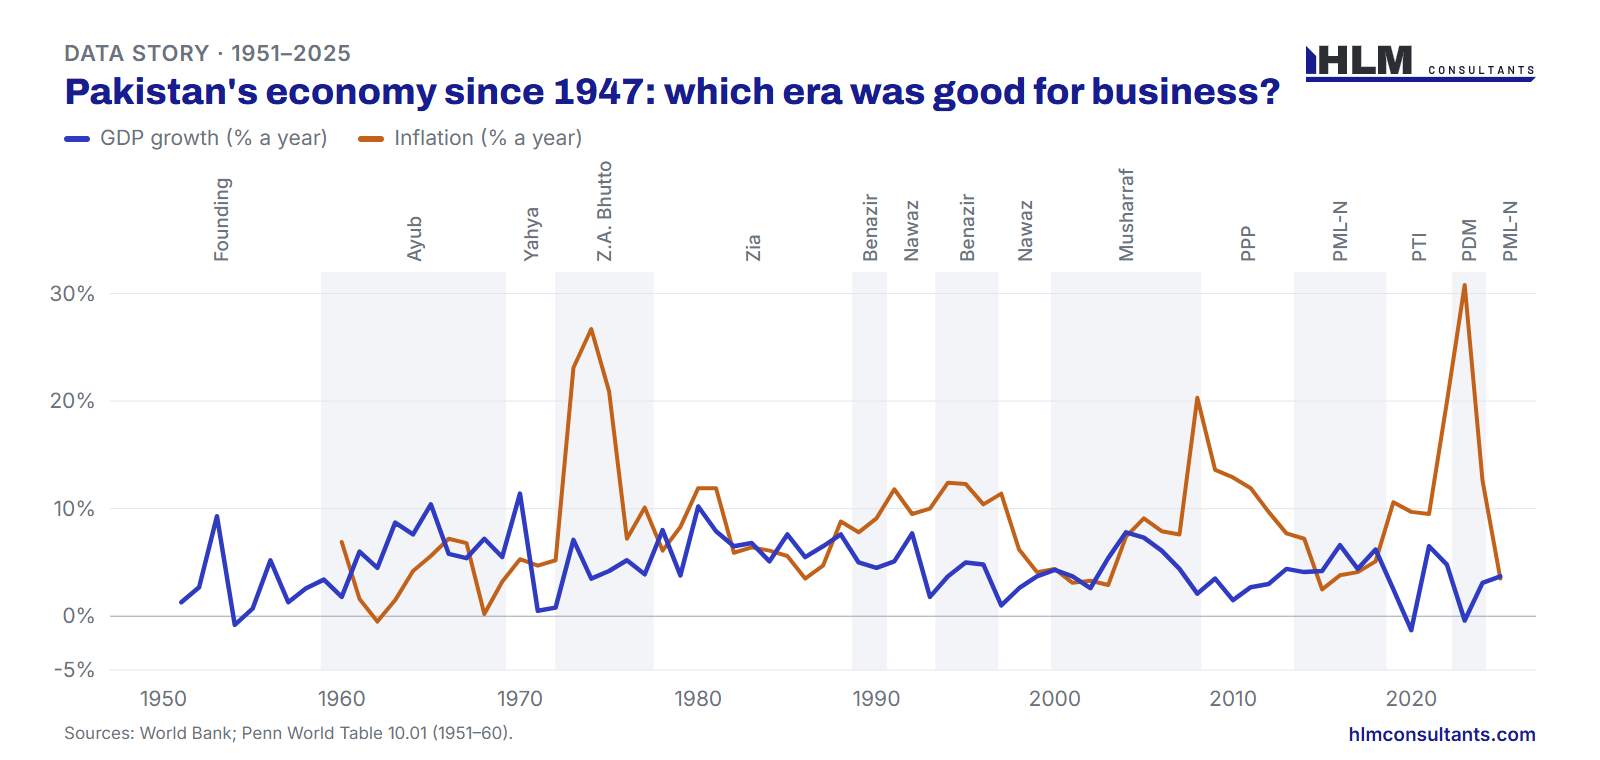
Every business owner in Pakistan has heard someone say "business was better in those days". But which days? We put 75 years of data into one chart to see when the economy gave businesses strong growth with low inflation, and when it did not.
Press play below. The year and the government in power change at the top, every government is named above the chart, and the lines show GDP growth (how fast the economy grew) and inflation (how fast prices rose) for each year.
Summary by government
Good for business growth 5%+ and inflation under 8% · Mixed in between · Tough inflation 10%+ or growth under 3%
| Government | Growth | Inflation | For business |
|---|---|---|---|
| Founding yearsParliamentary · 1947–1958 | 2.8% | n/a | Tough |
| Ayub KhanMilitary rule · 1958–1969 | 6.0% | 3.7% | Good for business |
| Yahya KhanMilitary rule · 1969–1971 | 6.0% | 5.0% | Good for business |
| Zulfikar Ali BhuttoPPP · 1971–1977 | 4.1% | 15.5% | Tough |
| Zia-ul-HaqMilitary rule · 1977–1988 | 6.9% | 7.2% | Good for business |
| Benazir BhuttoPPP · 1988–1990 | 4.8% | 8.4% | Mixed |
| Nawaz SharifIJI · 1990–1993 | 4.9% | 10.4% | Tough |
| Benazir BhuttoPPP · 1993–1996 | 4.5% | 11.7% | Tough |
| Nawaz SharifPML-N · 1996–1999 | 2.4% | 7.2% | Tough |
| Pervez MusharrafMilitary-led · 1999–2008 | 4.9% | 7.3% | Mixed |
| Zardari / GilaniPPP · 2008–2013 | 3.0% | 11.2% | Tough |
| Nawaz Sharif / AbbasiPML-N · 2013–2018 | 5.1% | 4.5% | Good for business |
| Imran KhanPTI · 2018–2022 | 3.1% | 12.4% | Tough |
| Shehbaz Sharif + caretakerPDM coalition · 2022–2024 | 1.4% | 21.7% | Tough |
| Shehbaz SharifPML-N coalition · 2024–now | 3.7% | 3.5% | Mixed |
Averages of yearly figures. Short periods (2–3 years) and outside events such as aid, oil prices, wars and floods affect every era.
How to read the chart
For a business, the best conditions are simple: customers have more money (high growth) and costs are stable (low inflation). When growth is low and inflation is high, sales stall while costs jump. That is the hardest place to run a business.
- Blue line above the orange line: the economy is growing faster than prices. Usually good years for business.
- Orange line far above the blue line: prices are rising much faster than the economy. Hard years: margins shrink and borrowing gets expensive.
The eras with high growth and low inflation
When the chart finishes, the Summary by government opens under it. Each government gets a simple label based on its averages:
- Good for business: growth 5% or more and inflation under 8%
- Mixed: in between
- Tough: inflation 10% or more, or growth under 3%
The governments marked Good for business:
- Ayub Khan (1958–1969): about 6.0% average growth with about 3.7% inflation. An industrial push, supported by large foreign aid.
- Zia-ul-Haq (1977–1988): the highest average growth, about 6.9%, with about 7.2% inflation. Remittances from the Gulf and Afghan-war era aid played a big part.
- PML-N (2013–2018): about 5.1% growth with about 4.5% inflation, helped by low global oil prices and CPEC investment, under an IMF programme.
The eras marked "Tough"
- 2022–2024 (PDM government and caretaker): about 1.4% growth with about 21.7% inflation, the widest gap in the chart. The 2022 floods and record inflation hit at the same time.
- Zulfikar Ali Bhutto (1971–1977): about 4.1% growth with about 15.5% inflation. The 1973 global oil shock and the nationalisation of industries and banks.
- PTI (2018–2022): about 3.1% growth with about 12.4% inflation, including the COVID-19 slump of 2020.
- PPP (2008–2013): about 3.0% growth with about 11.2% inflation, starting with the global financial crisis and energy shortages.
- Nawaz Sharif (1997–1999): about 2.4% growth. The 1998 nuclear tests brought sanctions and frozen foreign currency accounts.
What the chart does not tell you
- Outside events matter as much as policy. Several high-growth periods came with large foreign aid or inflows; several hard periods came with oil shocks, wars, floods or global crises.
- Short eras have few data points. Yahya Khan (1969–1971), Benazir Bhutto (1988–1990) and the current government (from 2024) have only two or three years of data each.
- Growth can be borrowed. Some fast-growth years were followed by a balance-of-payments crisis and an IMF programme. The chart shows growth, not how it was paid for. (See our post on Pakistan's debt nearing Rs99 trillion.)
In short: this is a picture of the economy, not a ranking of leaders.
The lesson for business owners: plan for the cycle
The clearest pattern in 75 years is the boom-and-bust cycle. Growth picks up, imports and inflation rise, the rupee comes under pressure, an IMF programme follows, and growth slows again. It has happened many times, under every kind of government.
What that means for you:
- Never plan on the good years lasting. Build your budget on a normal year, not a boom year.
- Keep a cash buffer for the bust. Every few years, sales slow and costs jump at the same time. A 13-week cash flow forecast shows you early when you are heading into trouble.
- Test your plan with high inflation. What happens to your margins if costs rise 20% in a year? Inflation has been 20% or more in three periods since 1973 (1973–75, 2008 and 2023). Our budgeting & forecasting service builds these scenarios for you.
- Lock in costs when you can. Longer contracts with suppliers and landlords protect you when inflation returns.
- Watch the signals. A widening trade deficit, a falling rupee and IMF talks have usually come before the hard years.
FAQ
Which era had the highest economic growth in Pakistan?
On average, the Zia-ul-Haq era (1977–1988), at about 6.9% a year, followed by the Ayub Khan era (1958–1969) at about 6.0%, based on World Bank and Penn World Table data.
When was inflation highest in Pakistan?
The worst single year in the data is 2023, at about 30.8%. By era, 2022–2024 averaged about 21.7%, and 1971–1977 about 15.5%.
Is this data official?
Yes. Growth from 1961 and inflation from 1960 come from the World Bank's World Development Indicators, and growth for the 1950s from the Penn World Table (University of Groningen). There are no reliable yearly figures for 1947–1950.
Does this mean one party or leader was better than another?
No. The chart shows economic results, which depend heavily on outside events such as foreign aid, oil prices, wars and global crises. It is a guide to the business climate, not a political ranking.
Need help?
HLM Consultants helps businesses plan for every part of the cycle: cash flow forecasts, budgets with realistic scenarios, and financial models that hold up when inflation returns. See our Cash Flow Forecasting and Budgeting & Forecasting services, or contact us to talk to our team.
Sources: World Bank, World Development Indicators (GDP growth 1961–2025, consumer price inflation 1960–2025); Penn World Table 10.01, University of Groningen (GDP growth 1951–1960). Each year is counted under the government in power on 1 January of that year; era averages are simple averages and rounded. This post is general information, not financial advice.